Customising Information Display (LST-004)
Procedure Guideline
This procedure describes how you can configure the information in the various list screens in the Sense-i system to suit your personal preferences and the needs of each task you perform.
The screens in Sense-i provide us with information that helps us make the decisions we need to make. There are three things we need to be able to do in any report. These are;
1. Hide Non-Relevant Information
2. Filter Information
3. Group Information
Hiding Non-relevant Information
At times some of the information on the screen is not relevant to the task we are performing.
The system allows us to hide any information that is not relevant to what we are doing.
To hide information that is not relevant to what we are trying to do, we can do this in a number of ways;
We can hide a specific colum if you don't need to see the information related to that column. Right-click on the Column Heading and choose "Hide".

If you don't need to see ANY OF THE INFORMATION related to the entire band, right-click on the Band itself and choose "Hide".
The system will then hide the band and all the columns related to the entity represented by the band. In this case, the Customer Information band and all columns underneath the band will be hidden.
Another way to hide information is to keep specific bands showing and only hide specific columns.
To do this, right-click anywhere in the Grid and then choose Columns in the pop-up menu.
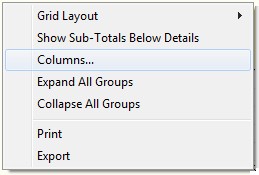
The program will display a screen that allows you to hide or (if they are already hidden) display specific bands & columns.
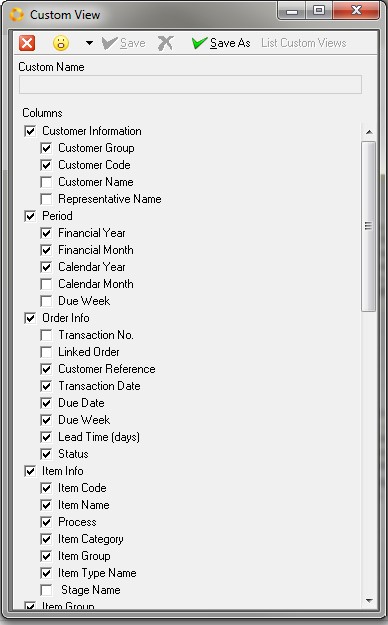
To hide any column simply click on the tick / checkbox to the left of the column name. The checkbox will be blank if the column is hidden.
To show a column in the grid, click the checkbox so that the tick is displayed.
Once you have selected the columns you wish to view, click the Save As button and then enter the name of your configured preferences in the Custom Name field.

The program will ask you if you want to save your configured preference as a default.
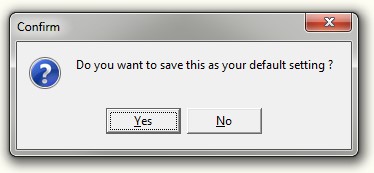
Choose Yes if the layout you have created is the layout you want to see each time you open that specific Grid screen.

The program keeps a list of each of the custom layout configurations you have created, and you can at any time choose to swap from one layout to another.
To swap between the different layouts, open the Custom View screen, select the layout of choice and click the List Custom Views button.
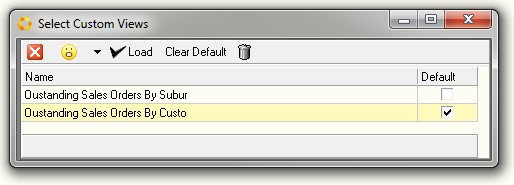
To change between layouts simply click on the name of the Layout Configuration you wish to view and click the Select / Load button.

Filter Information
Even after you have grouped the information in the report so that you can view the transactions by priority, and hidden information you do not need to see, you might still find the list contains too much information.
You can use the Quick Filter option to further filter information in the Grid.
Let's say that you only want to see orders that are more than 2 days late.
Click on the drop-down arrow (Top Right Corner) of the column heading that contains the information you wish to filter by, for example Delivery Variance (days).
The program will display a list of unique values that are in the grid and you can then check (tick displayed in checkbox) the ones you wish to see.

The program will display the values by which you have filtered the information in the grid at the bottom of the screen.

You can click on the drop-down arrow to swap between any of the filtered views you have created.
And you can click the Customize button to open a screen in which you can type more complex search filters.

Grouping Information
Before we look at an example of how to group the information, we need to look at two more Entities or Bands.
The first is the entity of Time or in the system called Period Information.
The second is the "Entity" called "Order". The information and details pertaining to an "Order" are displayed in columns underneath the "Order Information Band."
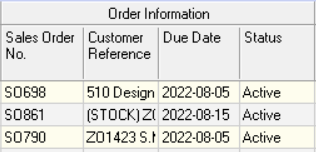
Here you can see the system displays information such as the;
-
"Order Number"
-
"Customer Reference information"
-
"Due Date"
-
"Status", and so on.
The Grouping function allows you to effectively sort the information in the grid so that you can concentrate and focus on dealing with what is most important.
Each of the Entities allow you to quickly and easily find and group information using the Enable Group function.
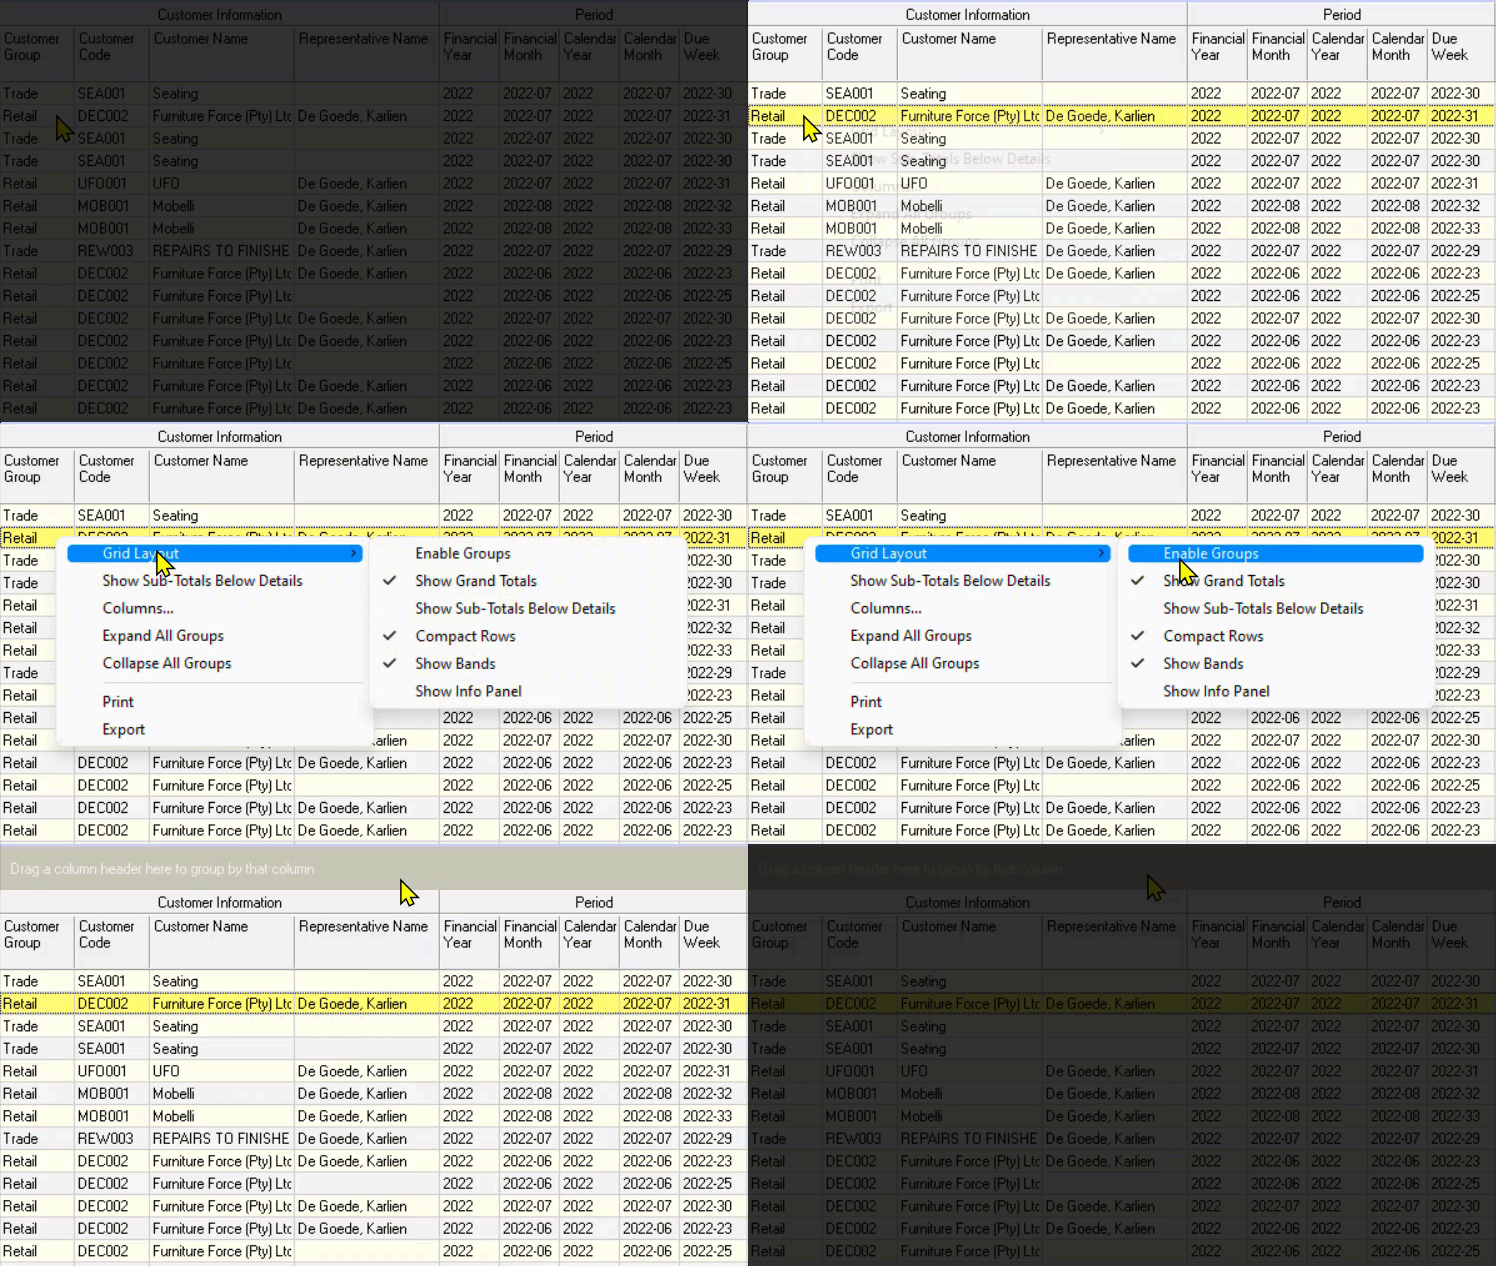
To group information in the grid, simply right-click the mouse anywhere in the grid content area and the program will display a small popup menu.
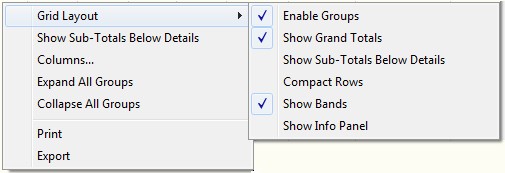
Click the Grid Layout option and then click the Enable Groups option.
When you do this the program will display a grey bar above the grid into which you can drag any column heading to arrange the information on your screen.
When you are looking at reports to decide what must be processed next, it is most useful to first group by Calendar Month, then by Due Week.
To arrange the report in this way, simply drag the Calendar Month column up into the grey group by bar and then drag the Due Week underneath it.

When you have done this you should see the following on the screen;
Then, depending on how you are going to prioritize and follow-up on the information the report, you can either group by some combination of;
-
Sales Rep
-
Customer (or Supplier)
-
Address
-
Department
And then finally by
- Order Number.
You might then end up with a grouping of your report as follows:
Such a report would tell you the following...
What orders are due to be delivered in each month and week, for each sales representative, in each suburb for each Customer.
The program will collapse all the detail so that you can then focus in on one transaction at a time.
To zoom in on the details you simply need to click the + sign next to each record to see the details.
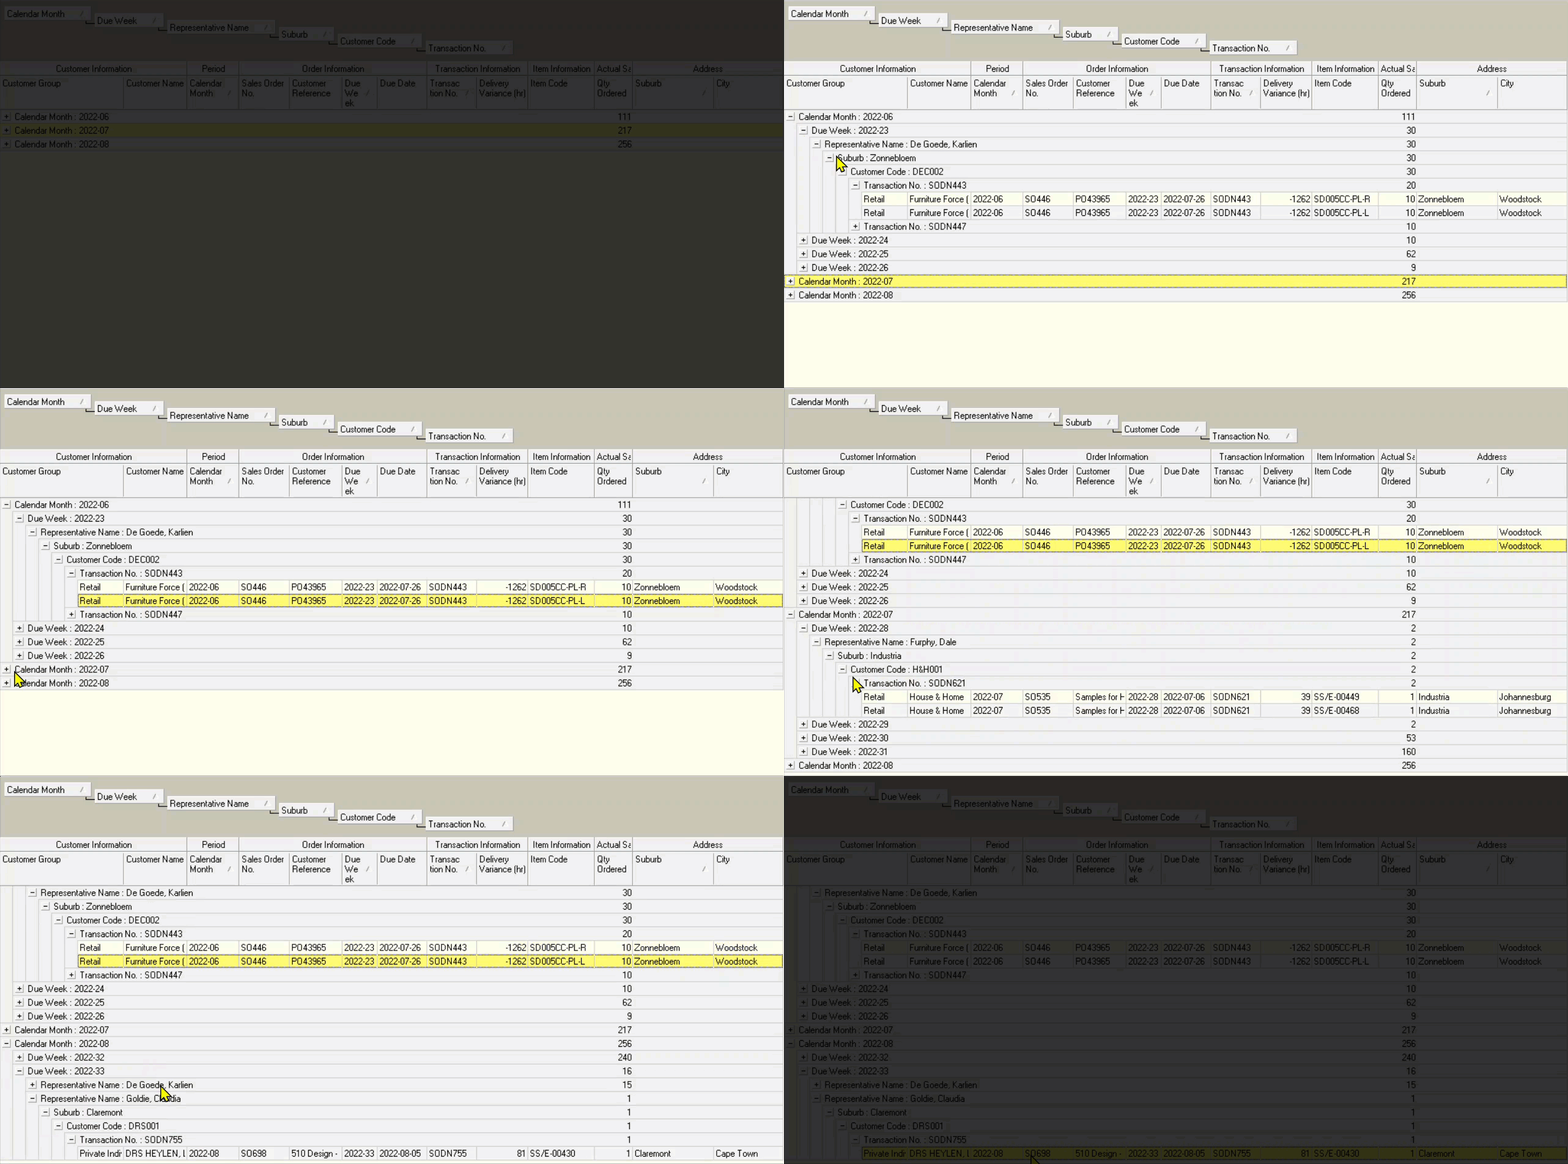
So, as a general rule, when you are looking at reports to decide what must be processed next, it is most useful to first group by Calendar Month, then by Due Week.
This is the end of the "Information Configuration" section.