Stock Analysis
Stock Analysis is a collection of inter-related screens that gives one the ability to analyze Stock across time and drill through to various detail level to reveal the source of the data.
From the main menu, navigate to Inventory > Stock Analysis.
The various types of stock and what transactions cause it to change are discussed in Stock Overview.
Stock Analysis Screen navigation
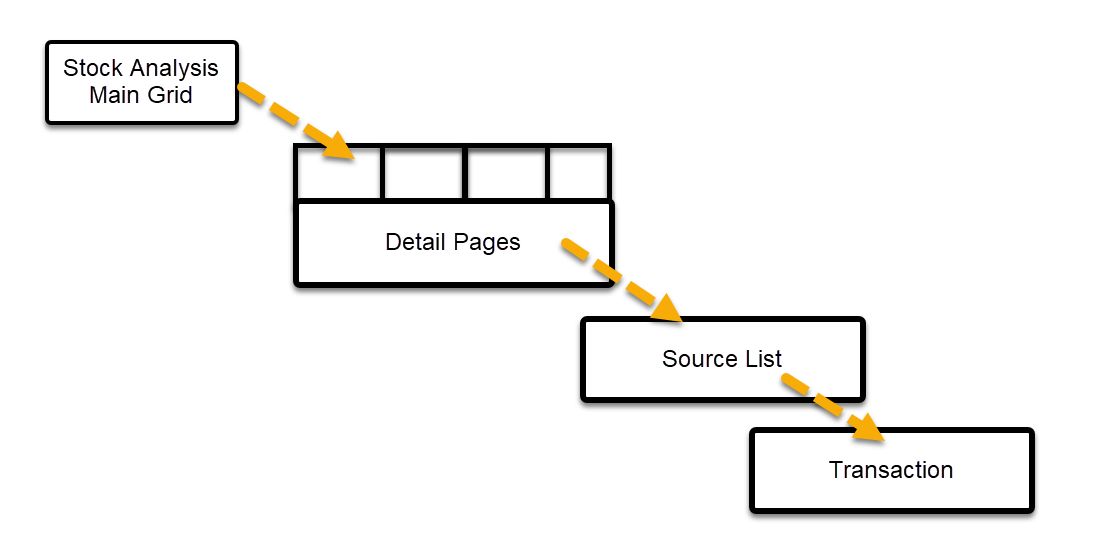
The Main (initial) screen displays the summary data for a chosen Stock Type.
From the Main screen one can drill into the Detail screen. This screen shows the stock details for the specific row/item currently selected on the main screen. It has 4 pages showing different data. Any and all stock detail data can be viewed from this screen regardless of the Stock Types selected on the main screen.
One would generally choose the Detail Page that correlates with the chosen Stock Type.
Most comprehensive Detail page is the Consolidated with Provisional Supply.
A further drill through from the Detail page on a specific cell will show a List of Source transactions summing up to the value in the selected cell.
Finally, one can drill through from the Source list to the corresponding Transaction.
Search Parameters
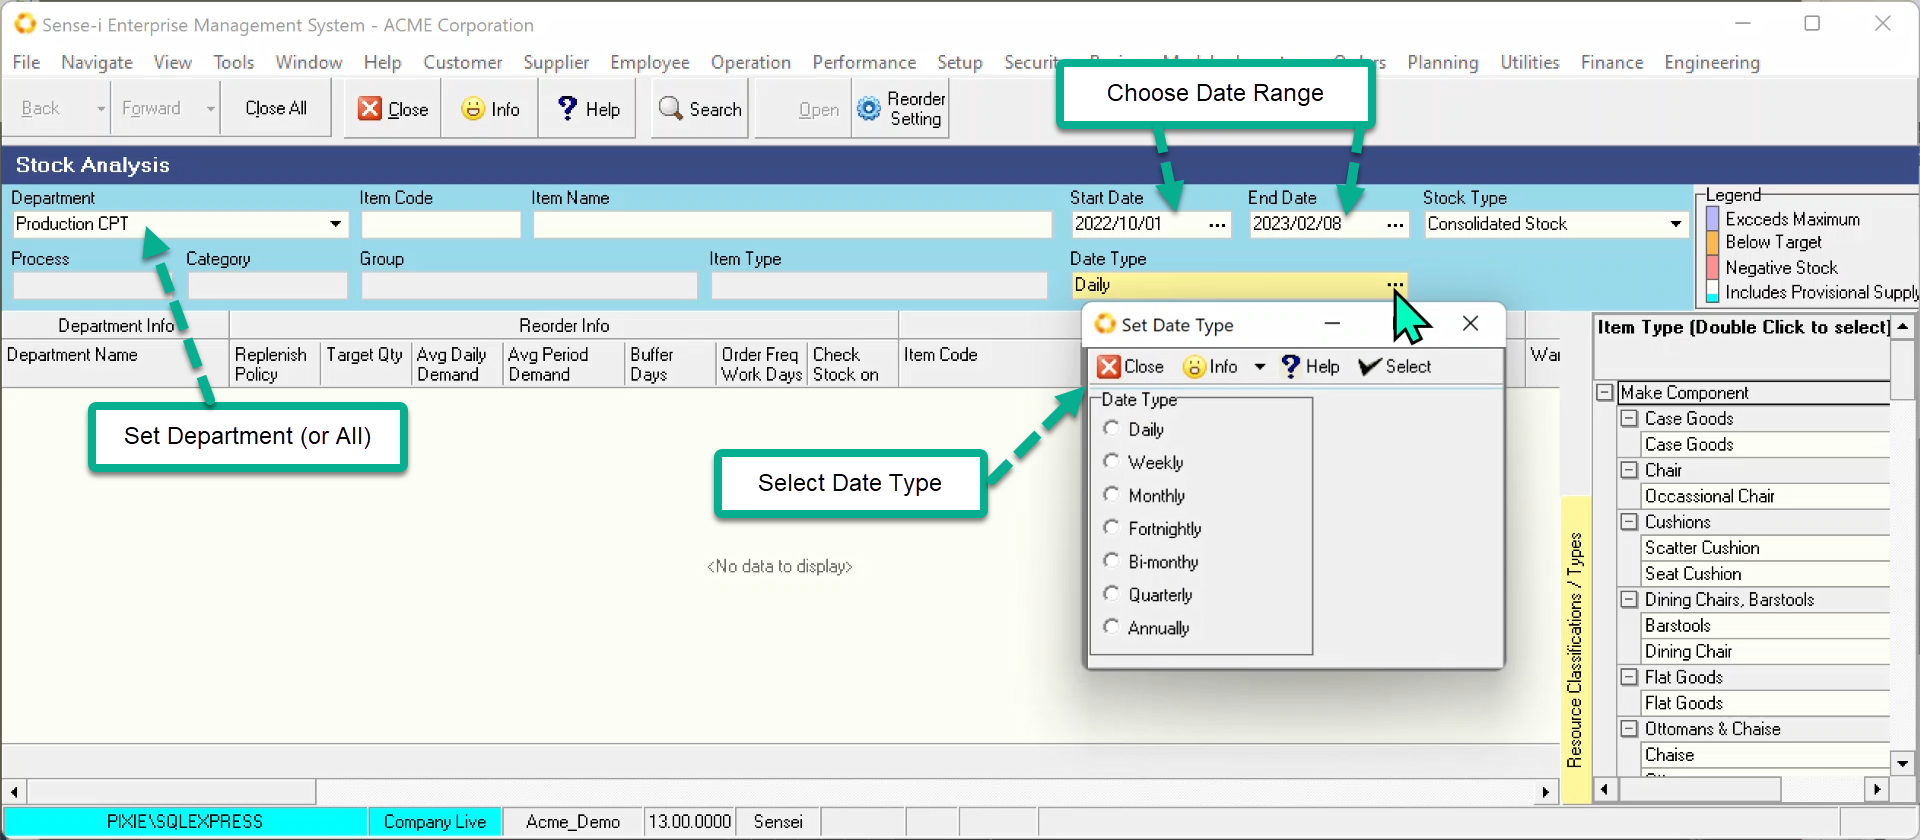
A Standard Search Panel allows one to choose the department you are analyzing. The Item search is standard and a specific item can be queried although generally one would double click the Item Type in the panel on the right.
Date Range and Type
The date columns run across the top of the grid. This is limited to a maximum of 31 periods. Clicking the drop-down button on the Date Type control lists the available Date Types. If one wants to see the data per month then the corresponding date range could span 2 and a half years. (12 months x 2.5 = 30).
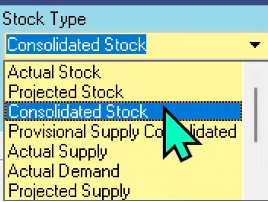
Stock Type
The Stock Type is the flavour of data you want to analyze. For the full list of stock types and how best to interpret the data, check out the various stock types listed below
Stock Analysis Main Screen
Once the search criteria have been set, click the Search button to populate the
grid.
- The headings in the Quantity columns show the Starting and Ending dates for each period which are derived from the chosen date type and range.
- The period columns are shaded according to the legend shown in the top right corner.
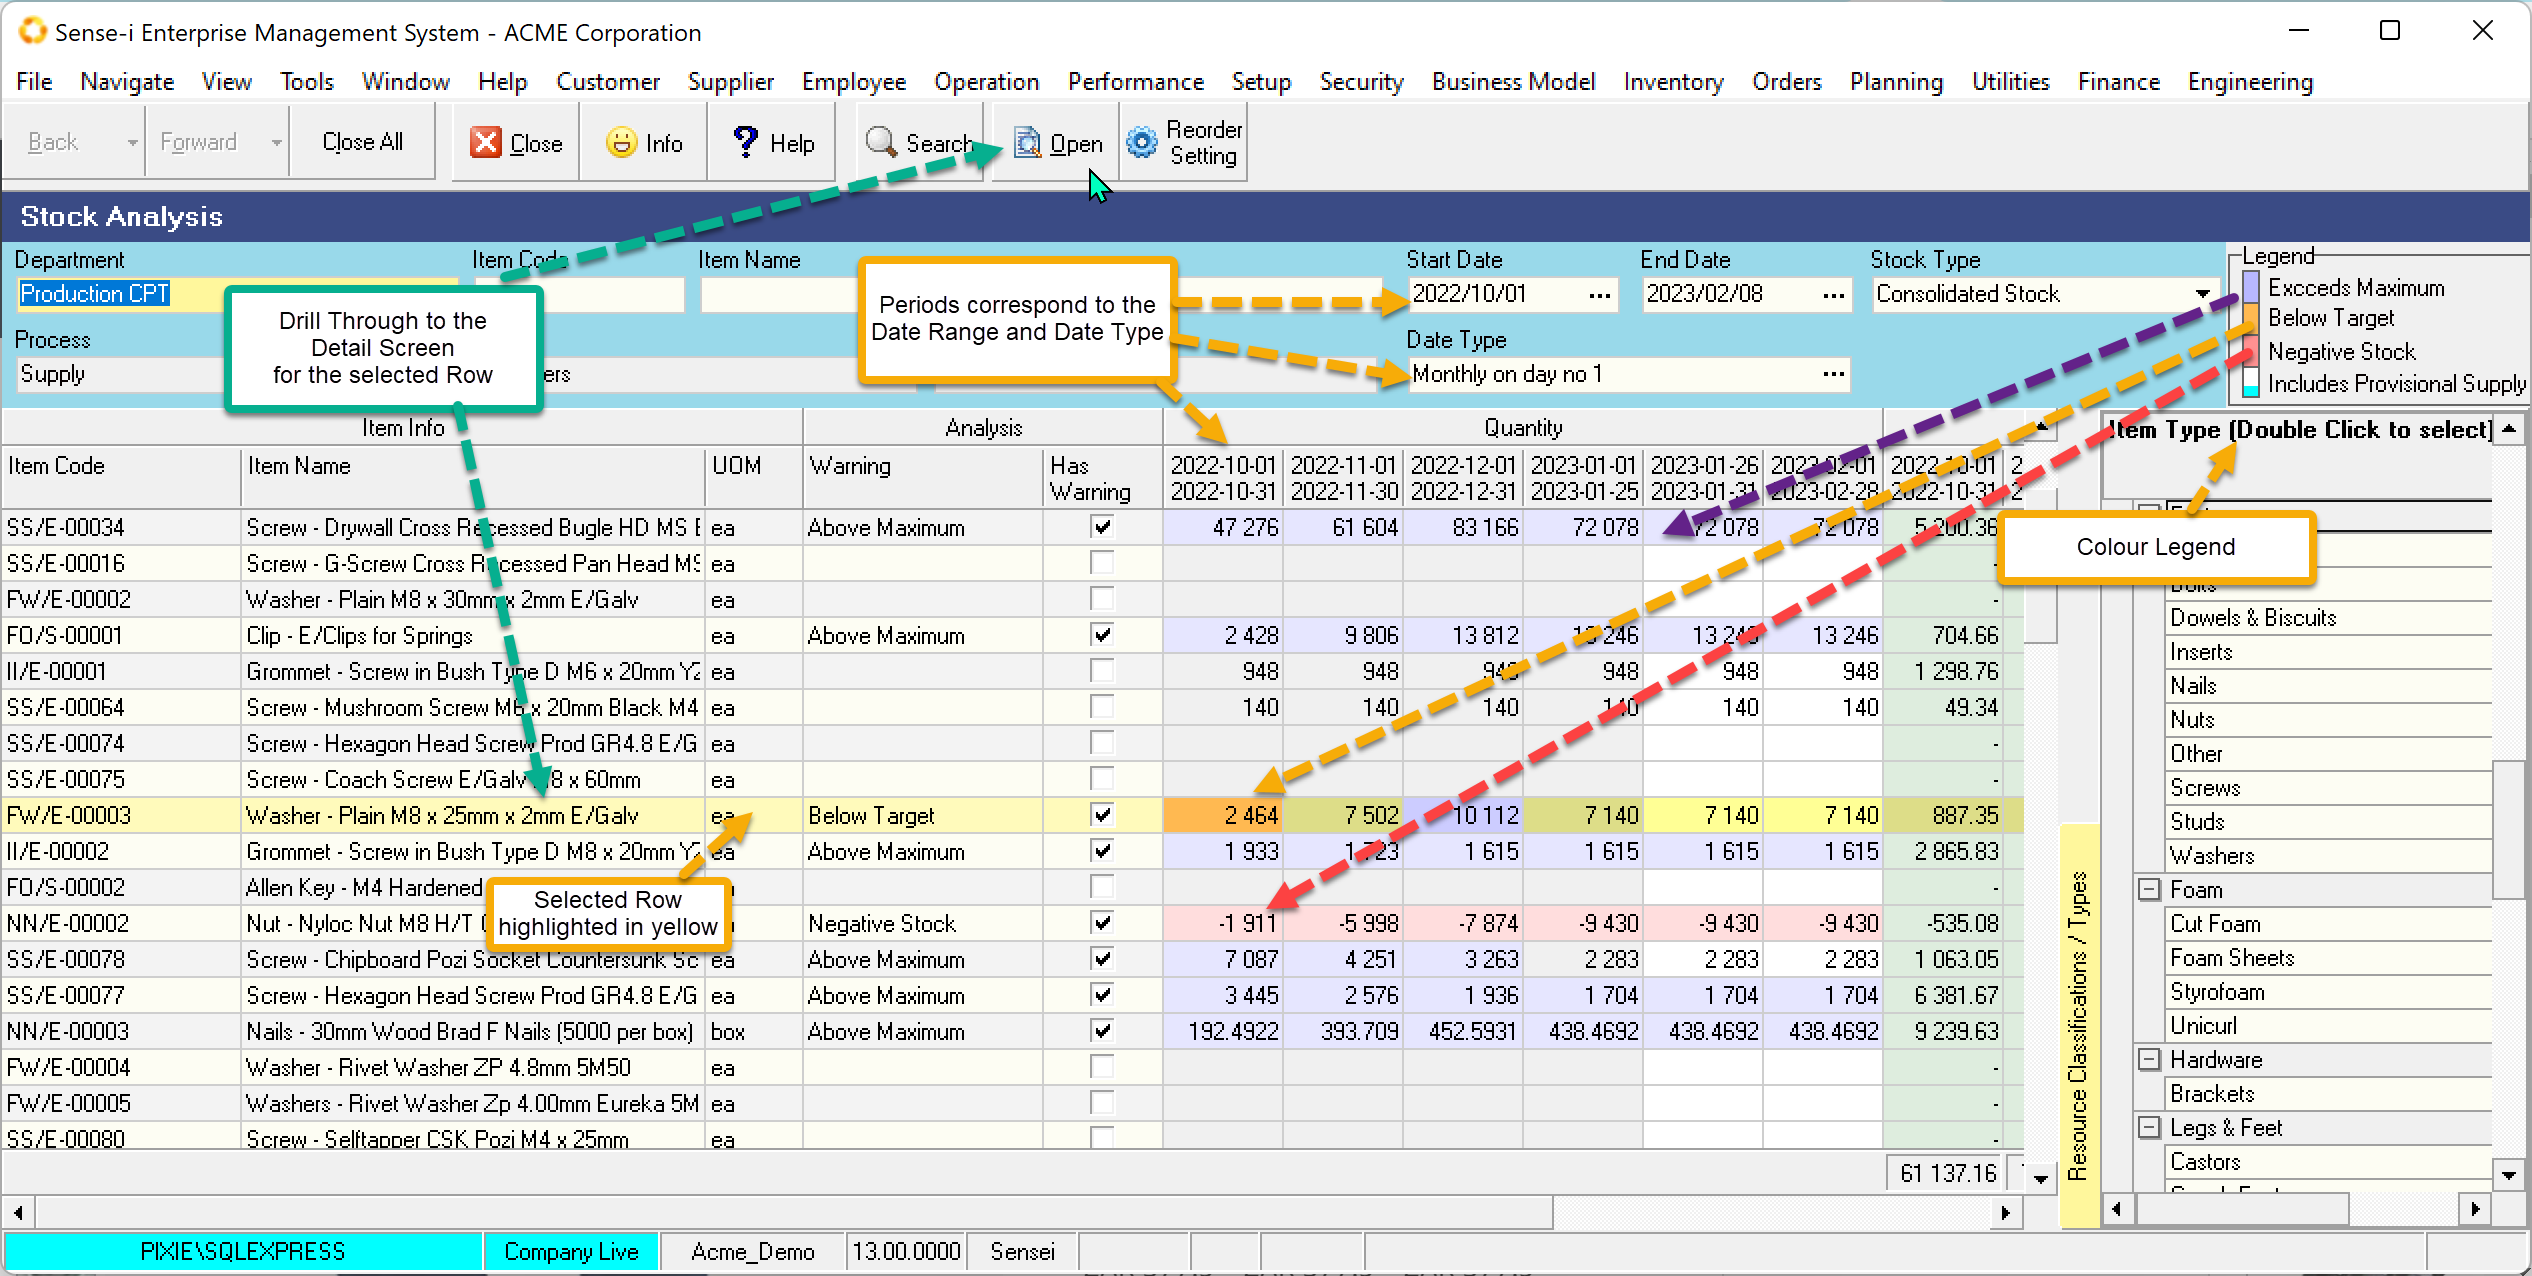
In order to drill through to the detail screen, select a row and then click
the Open button.
Stock Analysis Detail Screen
The detail screen has 5 pages/tabs.
- Actual
- Projected
- Consolidated
- Consolidated with Provisional Supply
- Summary
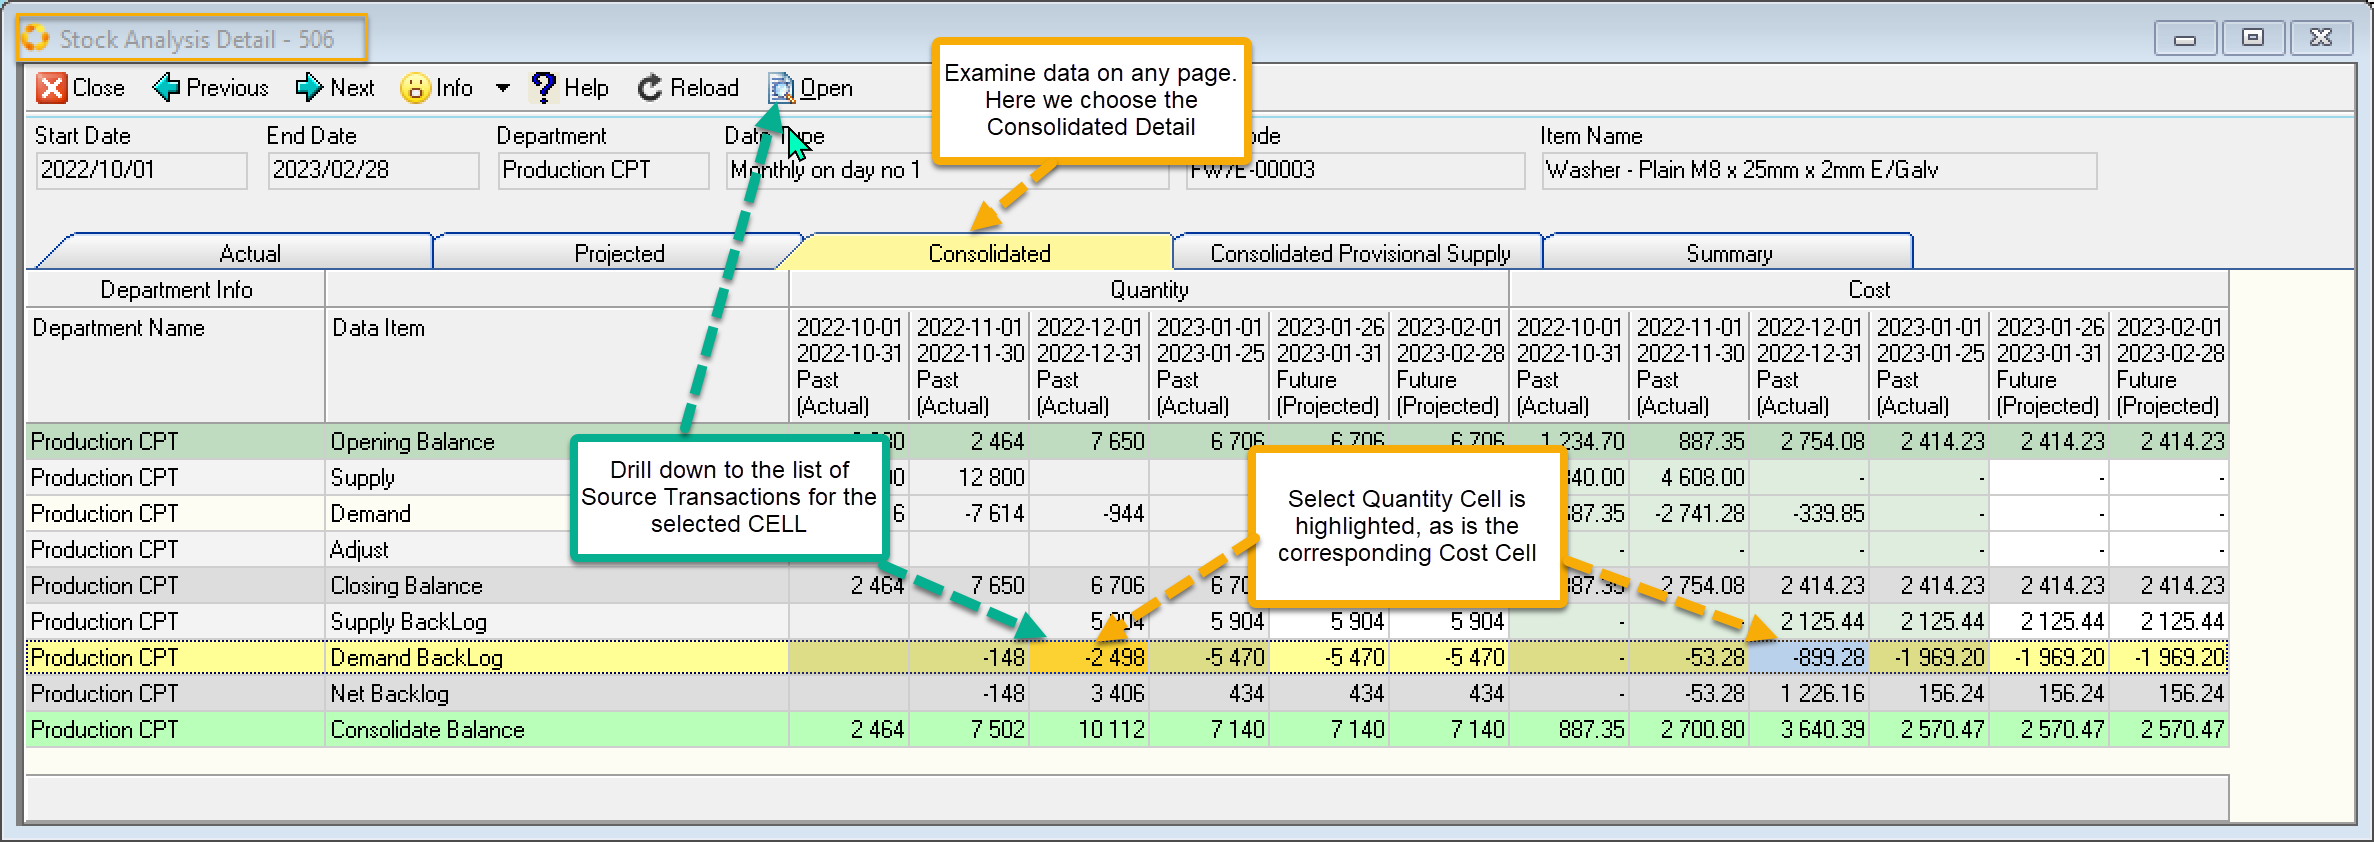
If you click on a quantity period column the corresponding cost column will be highlighed. Equally if you click on a cost column the corresponding quantity column will be highlighed.
Select a cell and click Open to display the source list screen.
Stock Analysis Source List Screen

The Stock Quantity column and Stock Cost column total to the value in the previous Source list screen.
A final drill through, by selecting a row and clicking Open displays the
Transaction.
Stock Analysis Transaction Screen
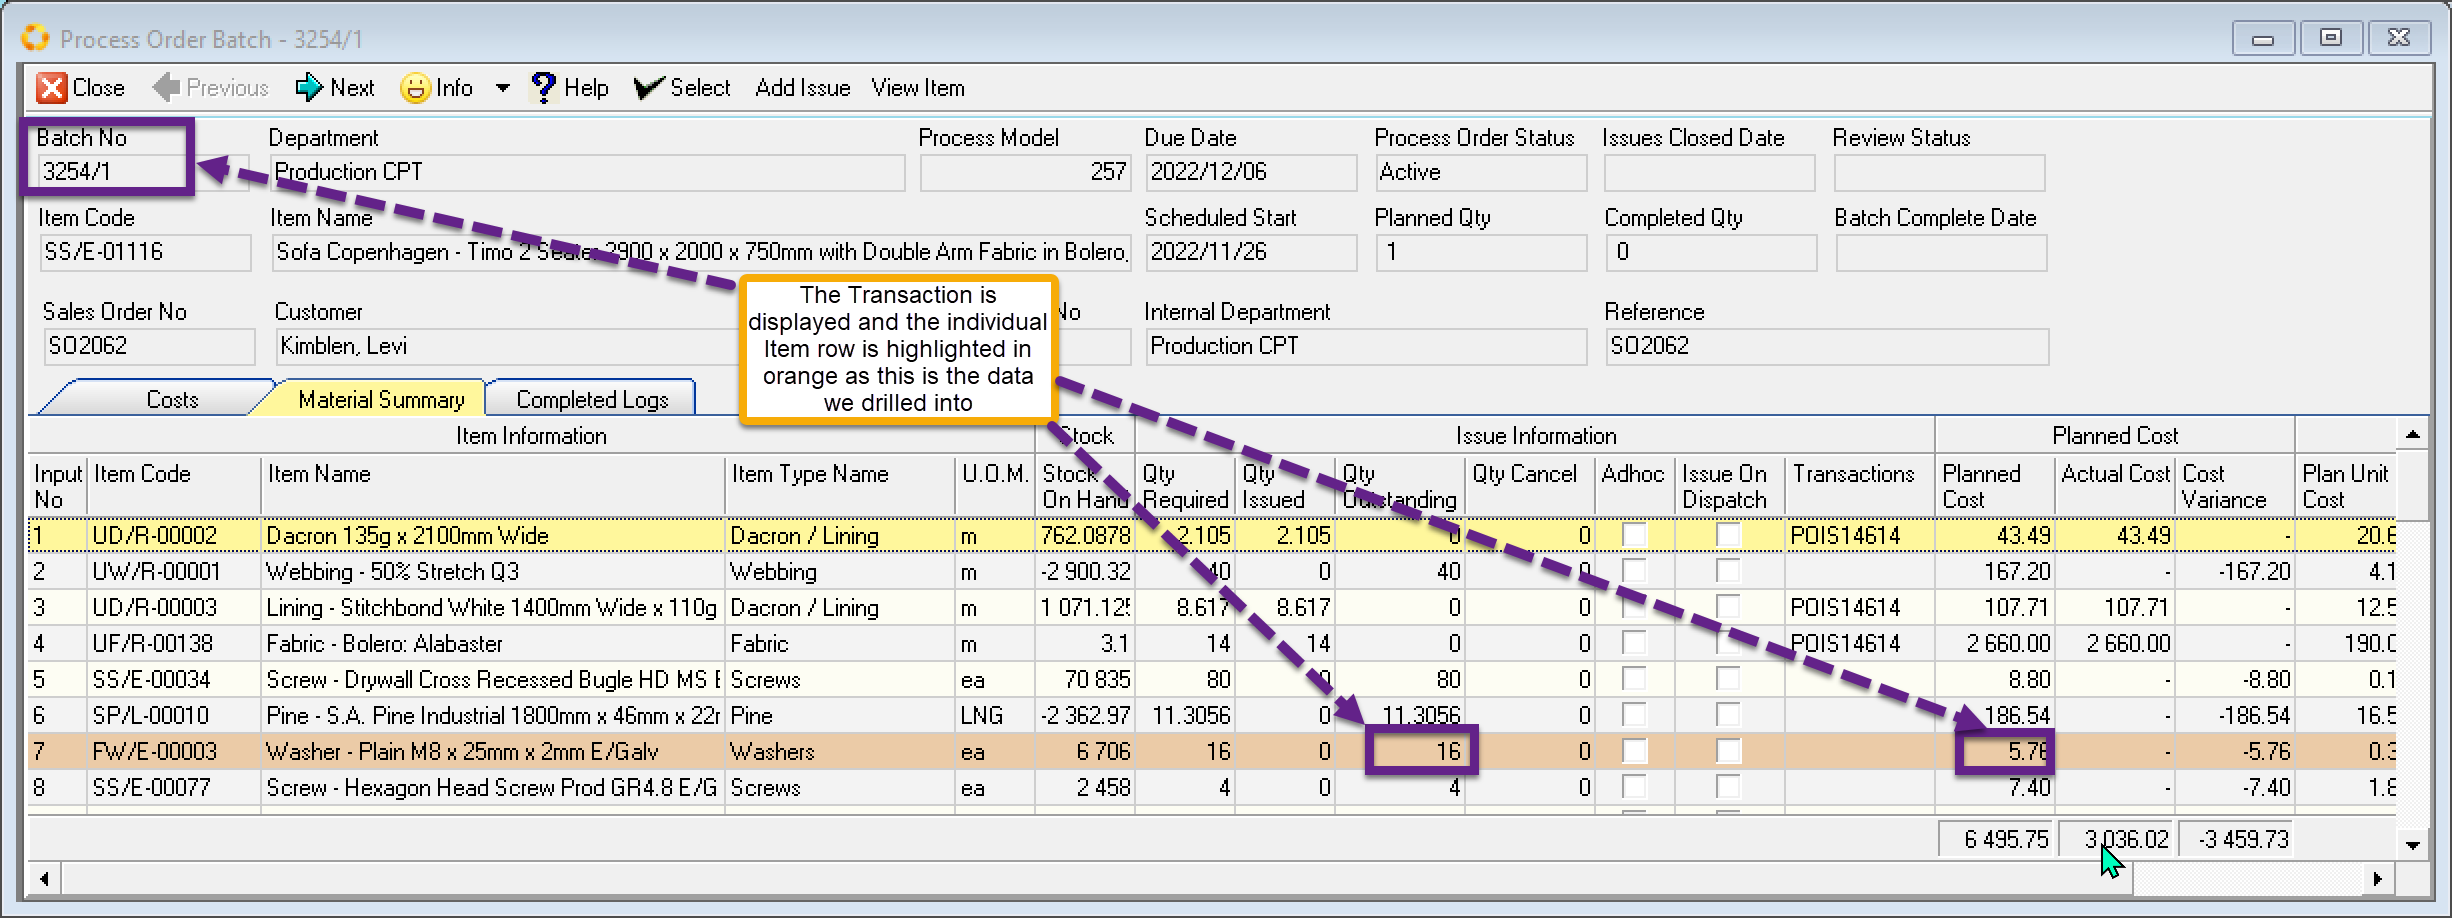
As a transaction typically has many line items, the particular item you are querying will be shaded in orange.
Stock Types
The various stock types can be analysed across time.
📄️ Actual Stock
Actual stock shows the running stock balance
📄️ Actual Supply
Actual Supply view shows the specific supply for given date periods.
📄️ Actual Demand
Actual Demand shows the Specific Actual Demand for given date periods.
📄️ Projected Stock
Projected Stock displays the running balance for Projected Transactions.
📄️ Projected Supply
Projected Supply shows you the sum of specific supply for a given period.
📄️ Projected Demand
Use the Projected Demand over time to:
📄️ Outstanding Projected Supply
Use this view to see which supply orders are running late and when supply orders are due to arrive. (Late and expected). We can see the expected costs for the upcoming orders.
📄️ Outstanding Projected Demand
Use this view to hone in on late issues and/or late capture of issue. Internal orders and
📄️ Consolidated Stock
The Consolidated Stock View for future dates gives timeous warnings before the stock runs out allowing one to proactively order (replenish). Viewed both in the past and future it alerts us to over-supply which can affect the cash flow in the business.
📄️ Consolidated with Provisional Supply
This is arguably the most powerful view of the Stock Analysis. Using the consolidated Stock to proactively order stock we need to be aware of provisional supplies in the pipeline. IE A Purchase order may be being prepared. This view is geared especially for replenishing by stock. It is advantageous to keep a record in the provisional state allowing us to up the order Quantity and gather other items into the order preventing small and piecemeal orders.
📄️ Provisional (Projected) Supply
This view shows the date and amount for the provisional supply. Below the screen is filtered to only return rows with data.